Background: This project was completed during my Internship with Jubo Health. Through this project I have gained a deeper understanding of how long-term care institutes operates and how I could make use of my skills to support them.
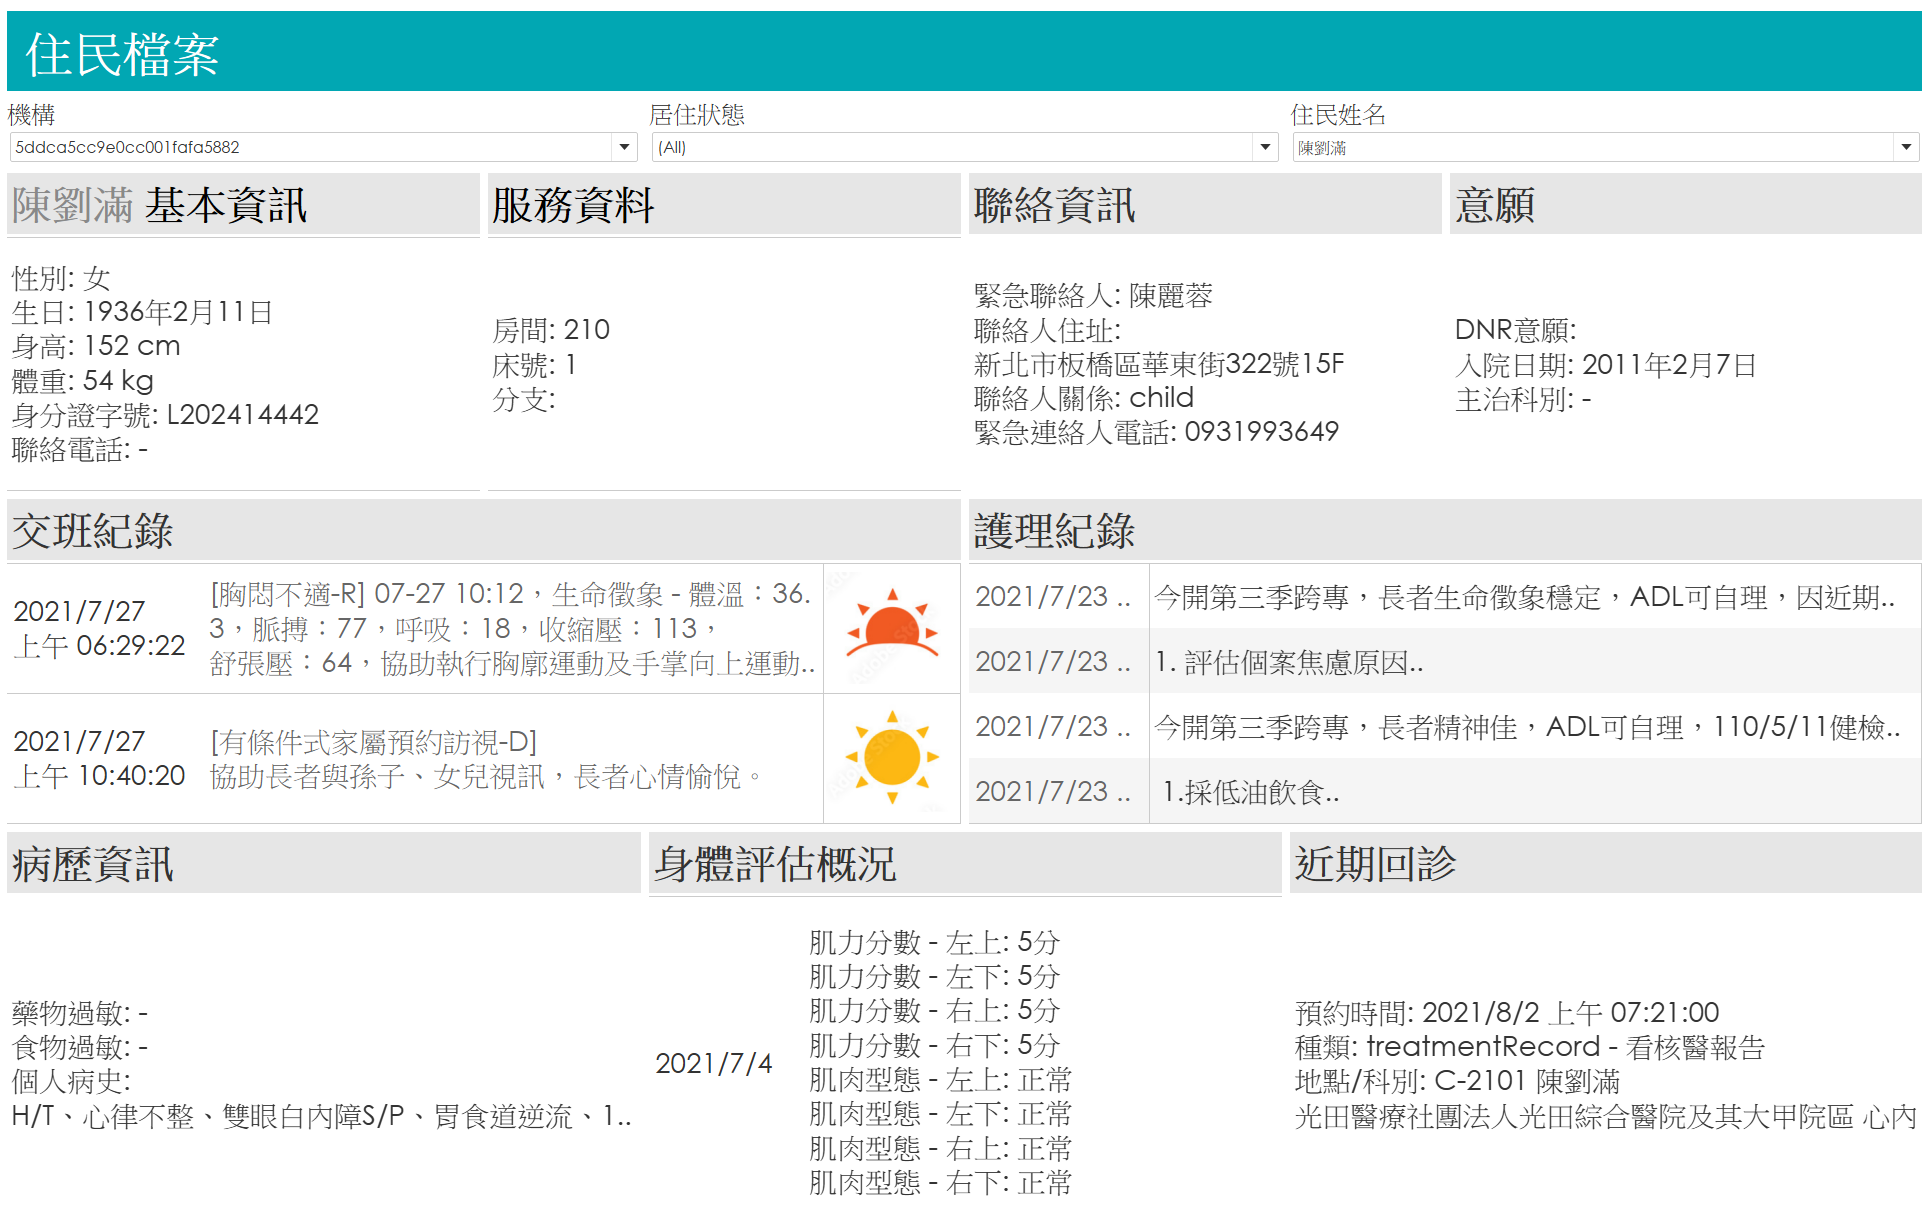
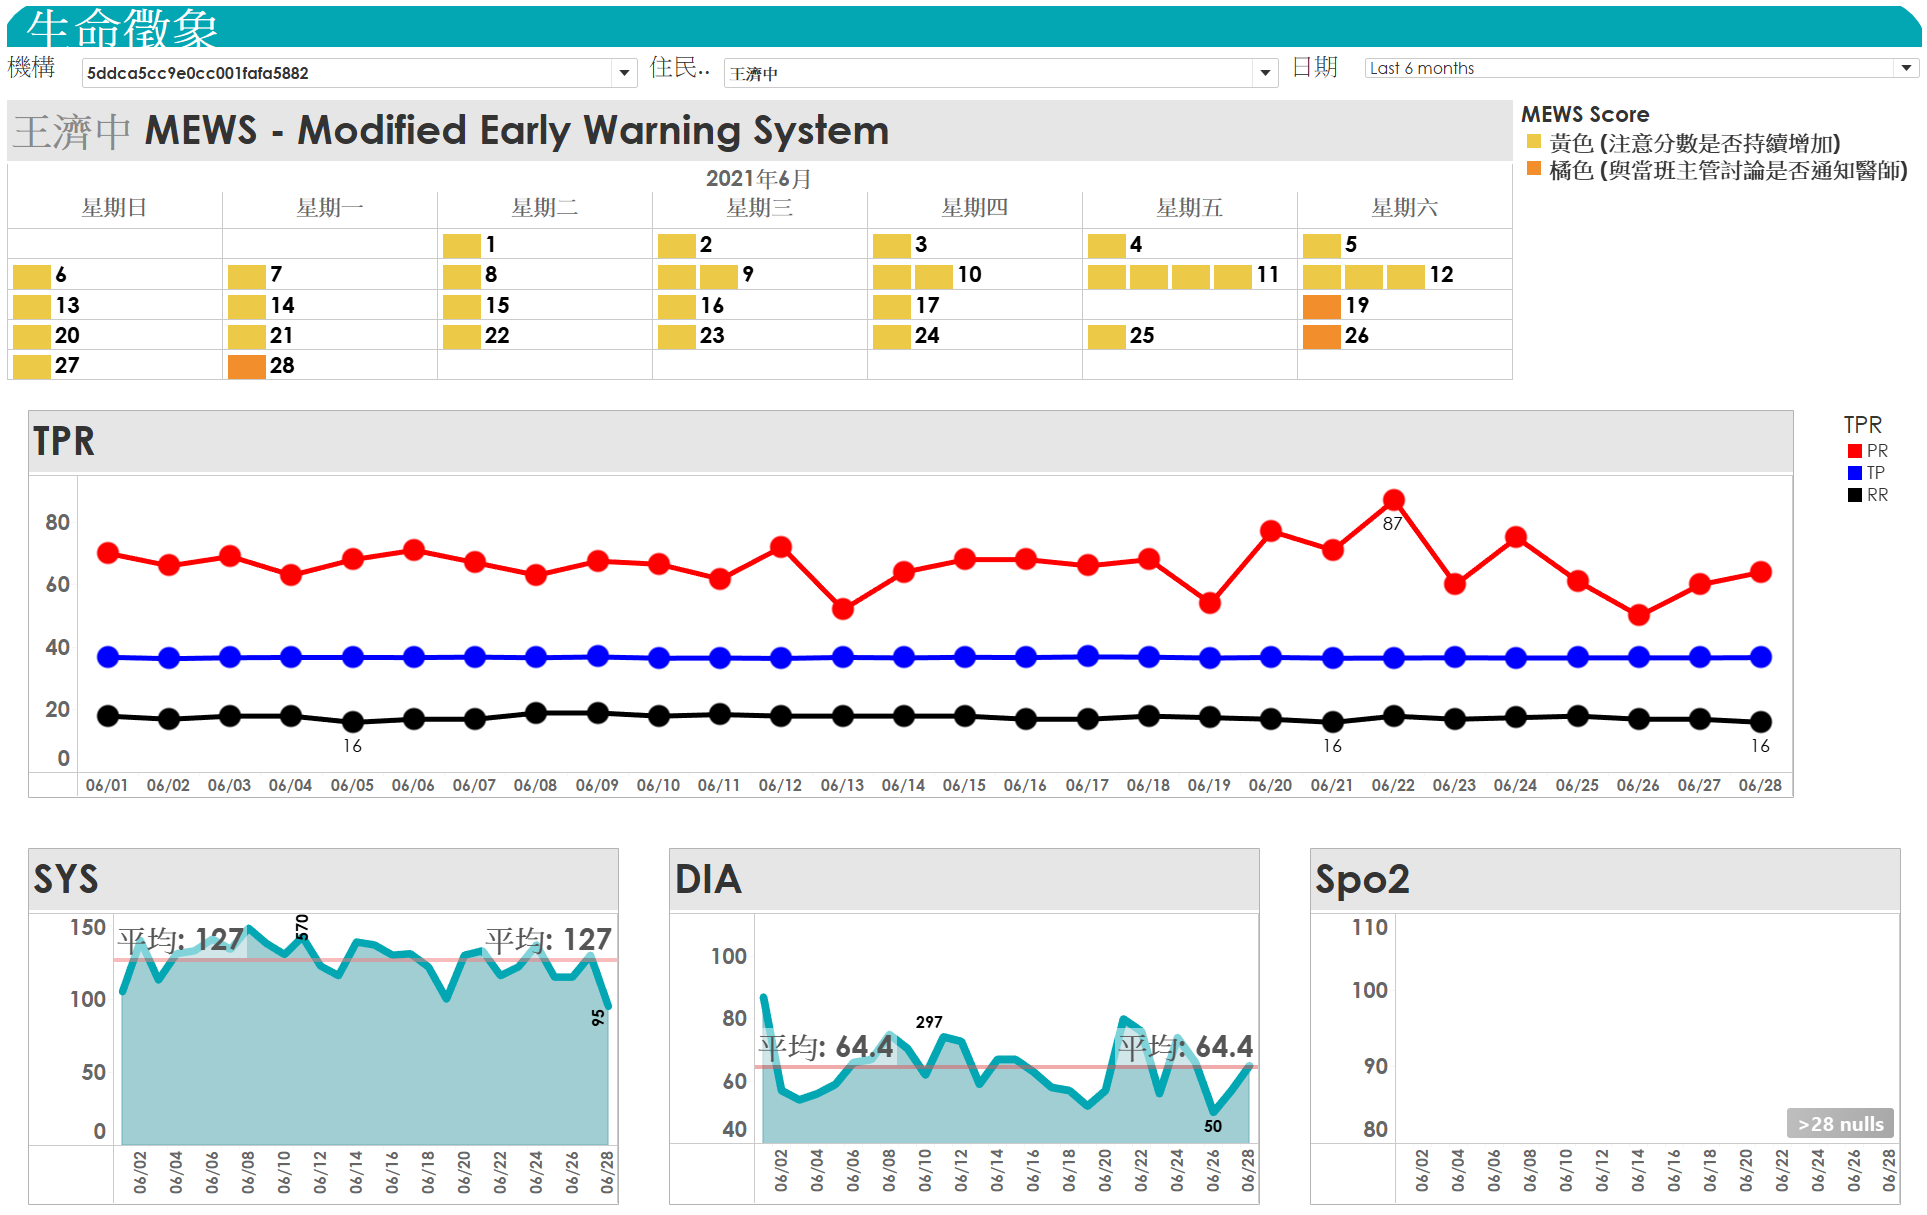
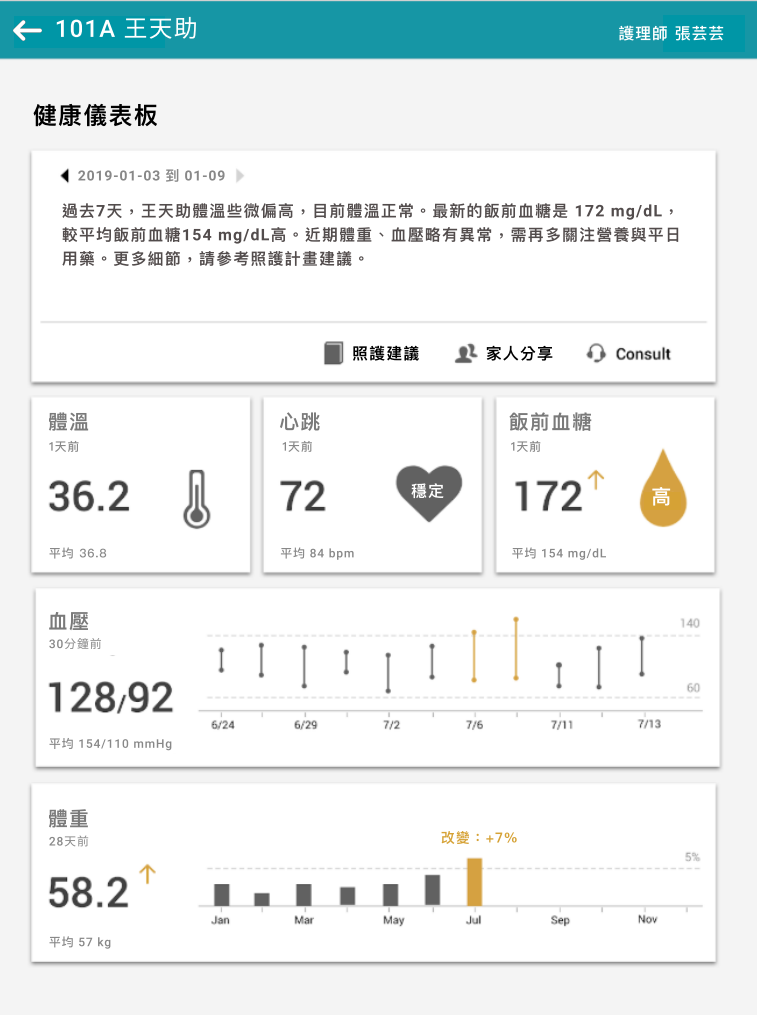
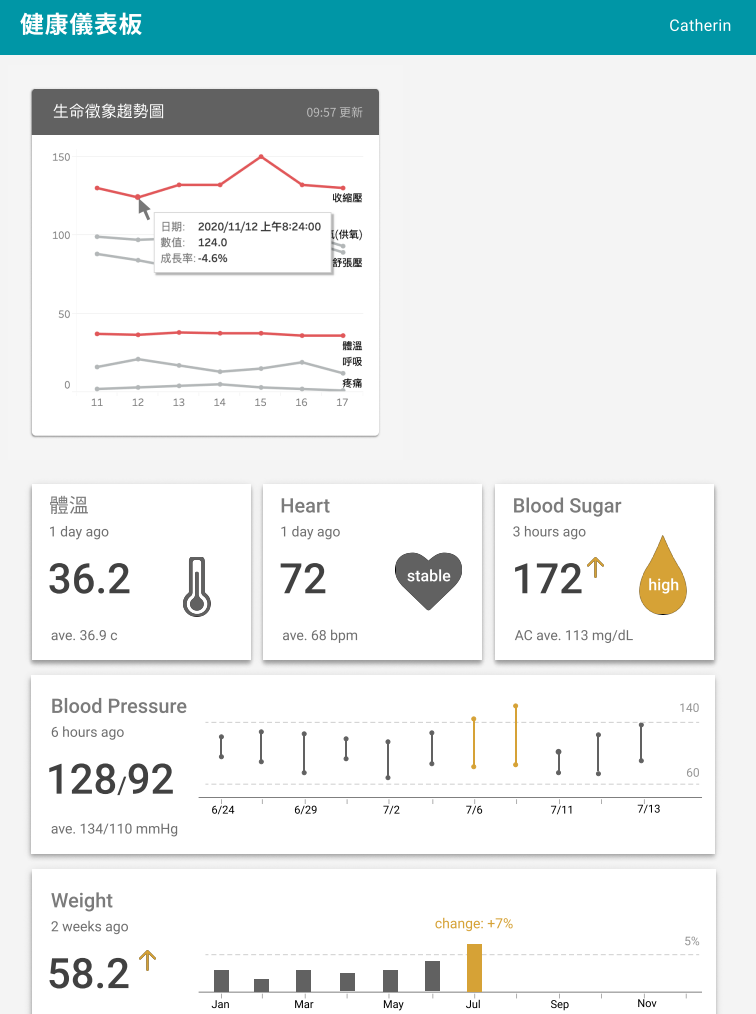
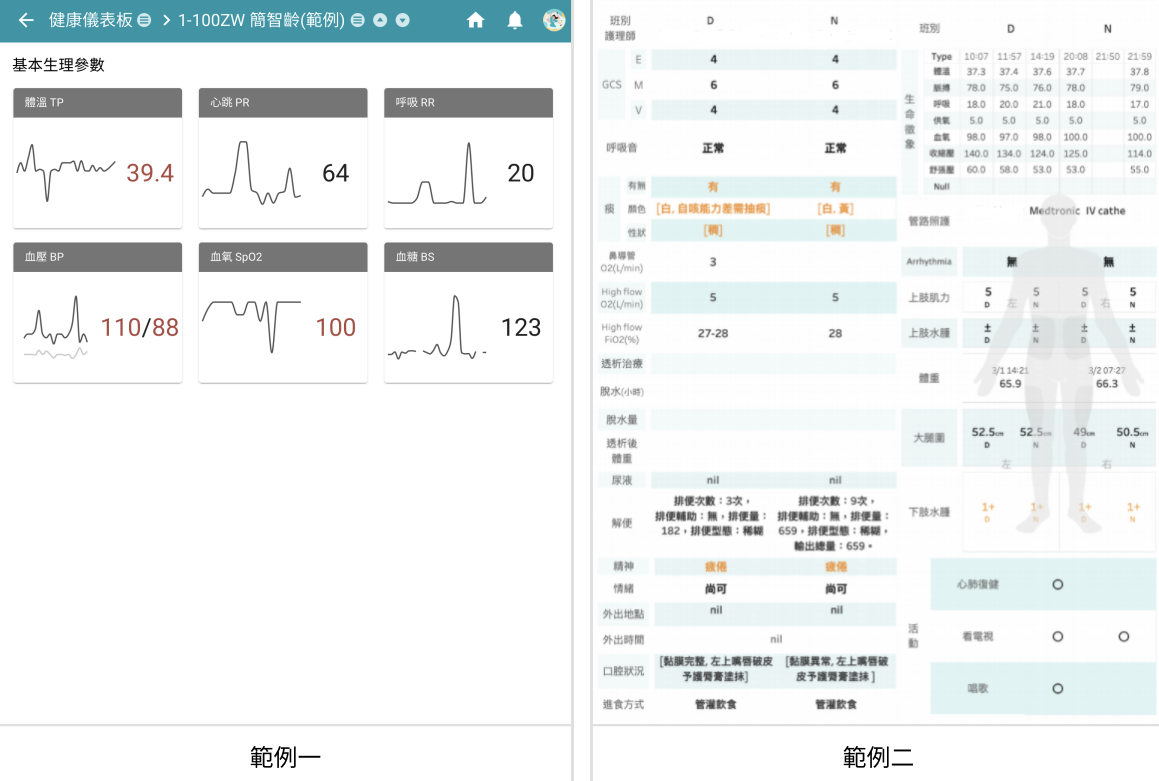
I joined the project to develop a prototype for the enhancement of jubo’s Nursing Information System. The aim was to create a data visualization dashboard embedded in NIS that could represent clients’ current and past health status from multiple domains of input.
The project was separated into two phases:
- Cooperated with Jubo’s
design team, customer success team, product team, data team to discuss the concept of what and how to be present in the dashboard. Conduct data analysis from MongoDB and implement the discussed concept through data visualization.
- Modified design concepts through user interviews (physician, nurse, nurse aide, nutritionist). Completed ETL process to hourly update the dashboard, and make the dashboard into a interactable web application.
Motivation: The existing system for healthcare professionals is imperfect, long-term care institutions are filled with paperwork, therefore, decreasing the efficacy in coworking with different functionalities. There is also a lack of complete system to track individual health history. This project aims to provide a solution to the existing issue.
The top 5 most desirable features within an individual health monitor dashboard is:
Elements
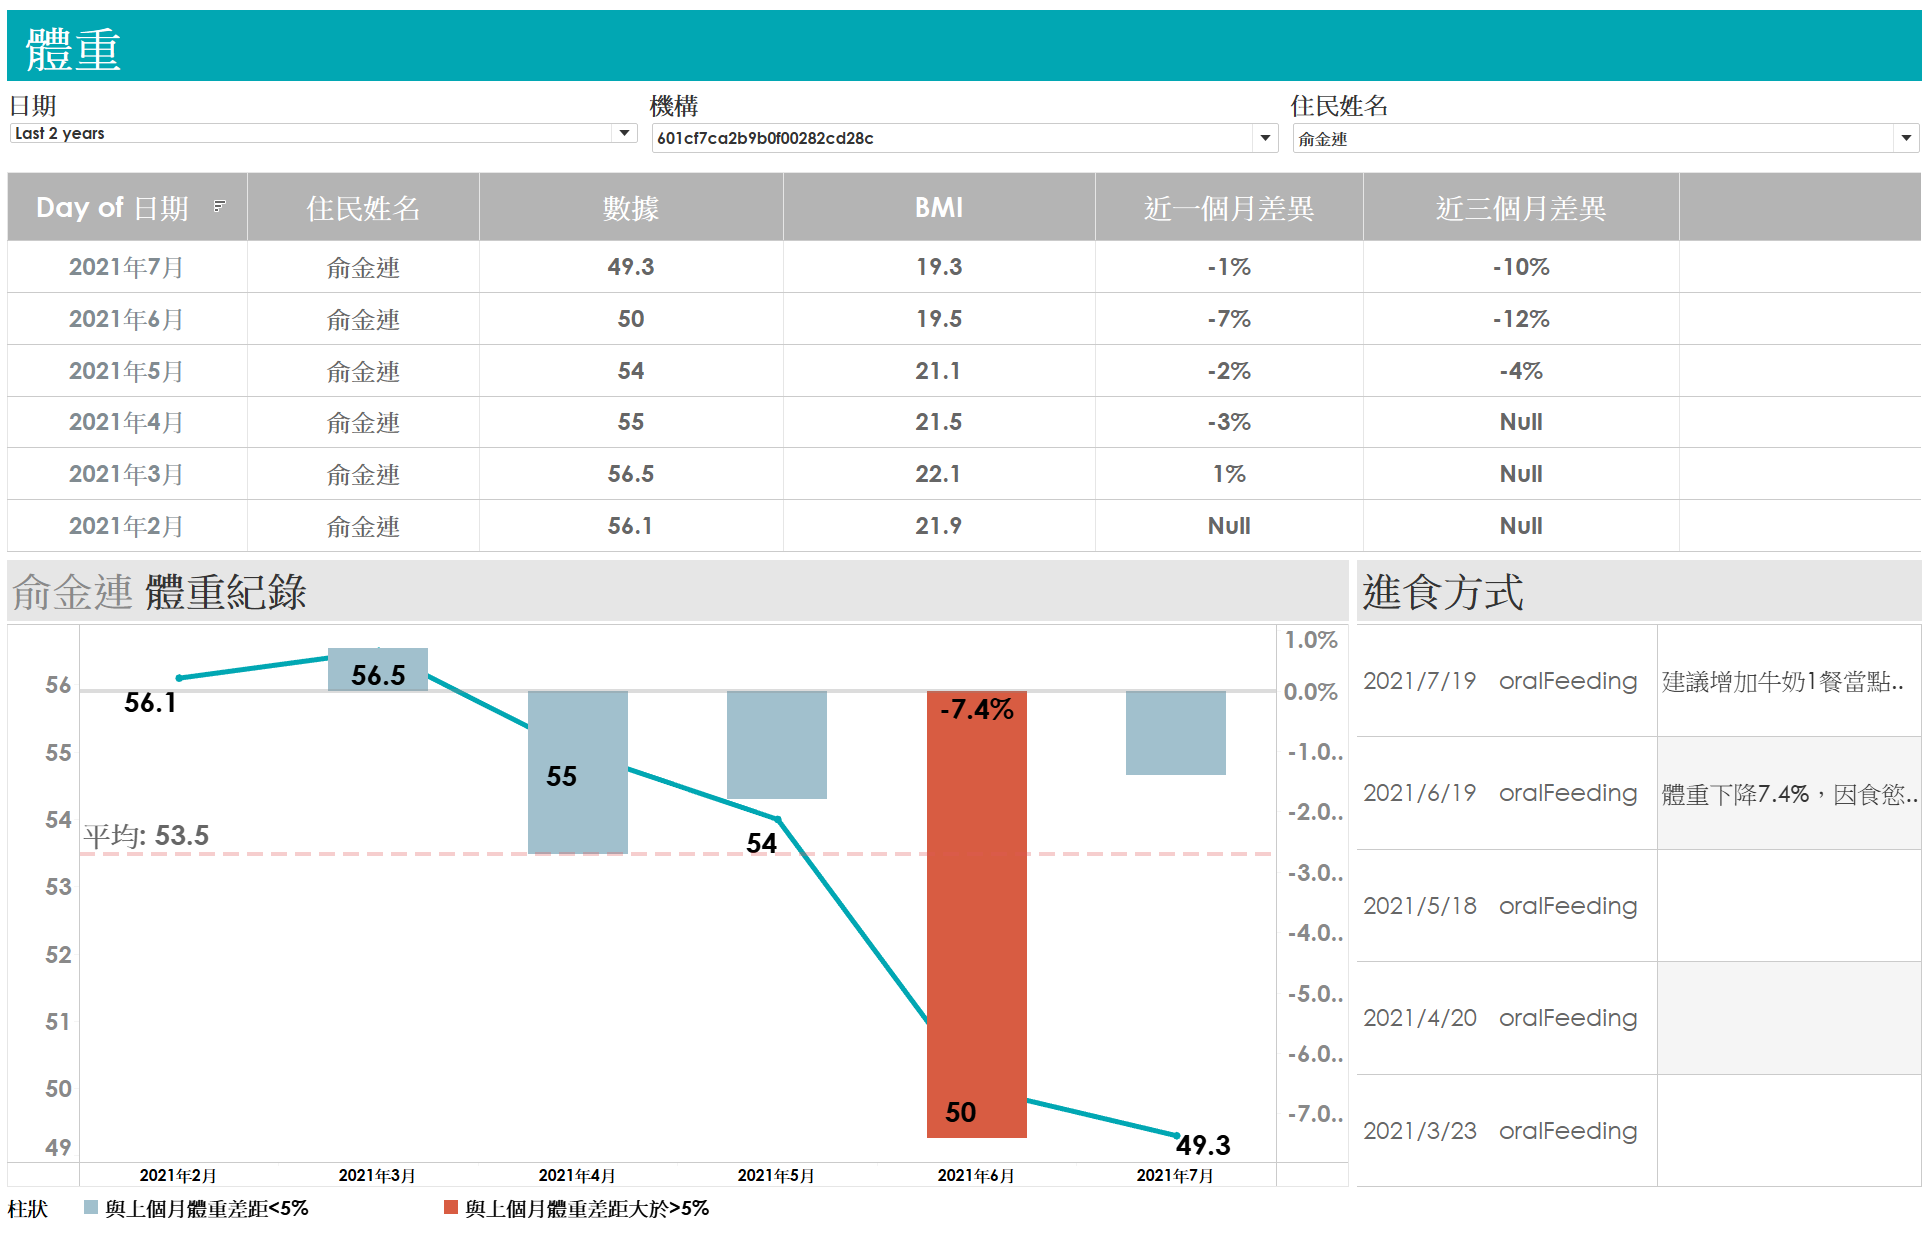
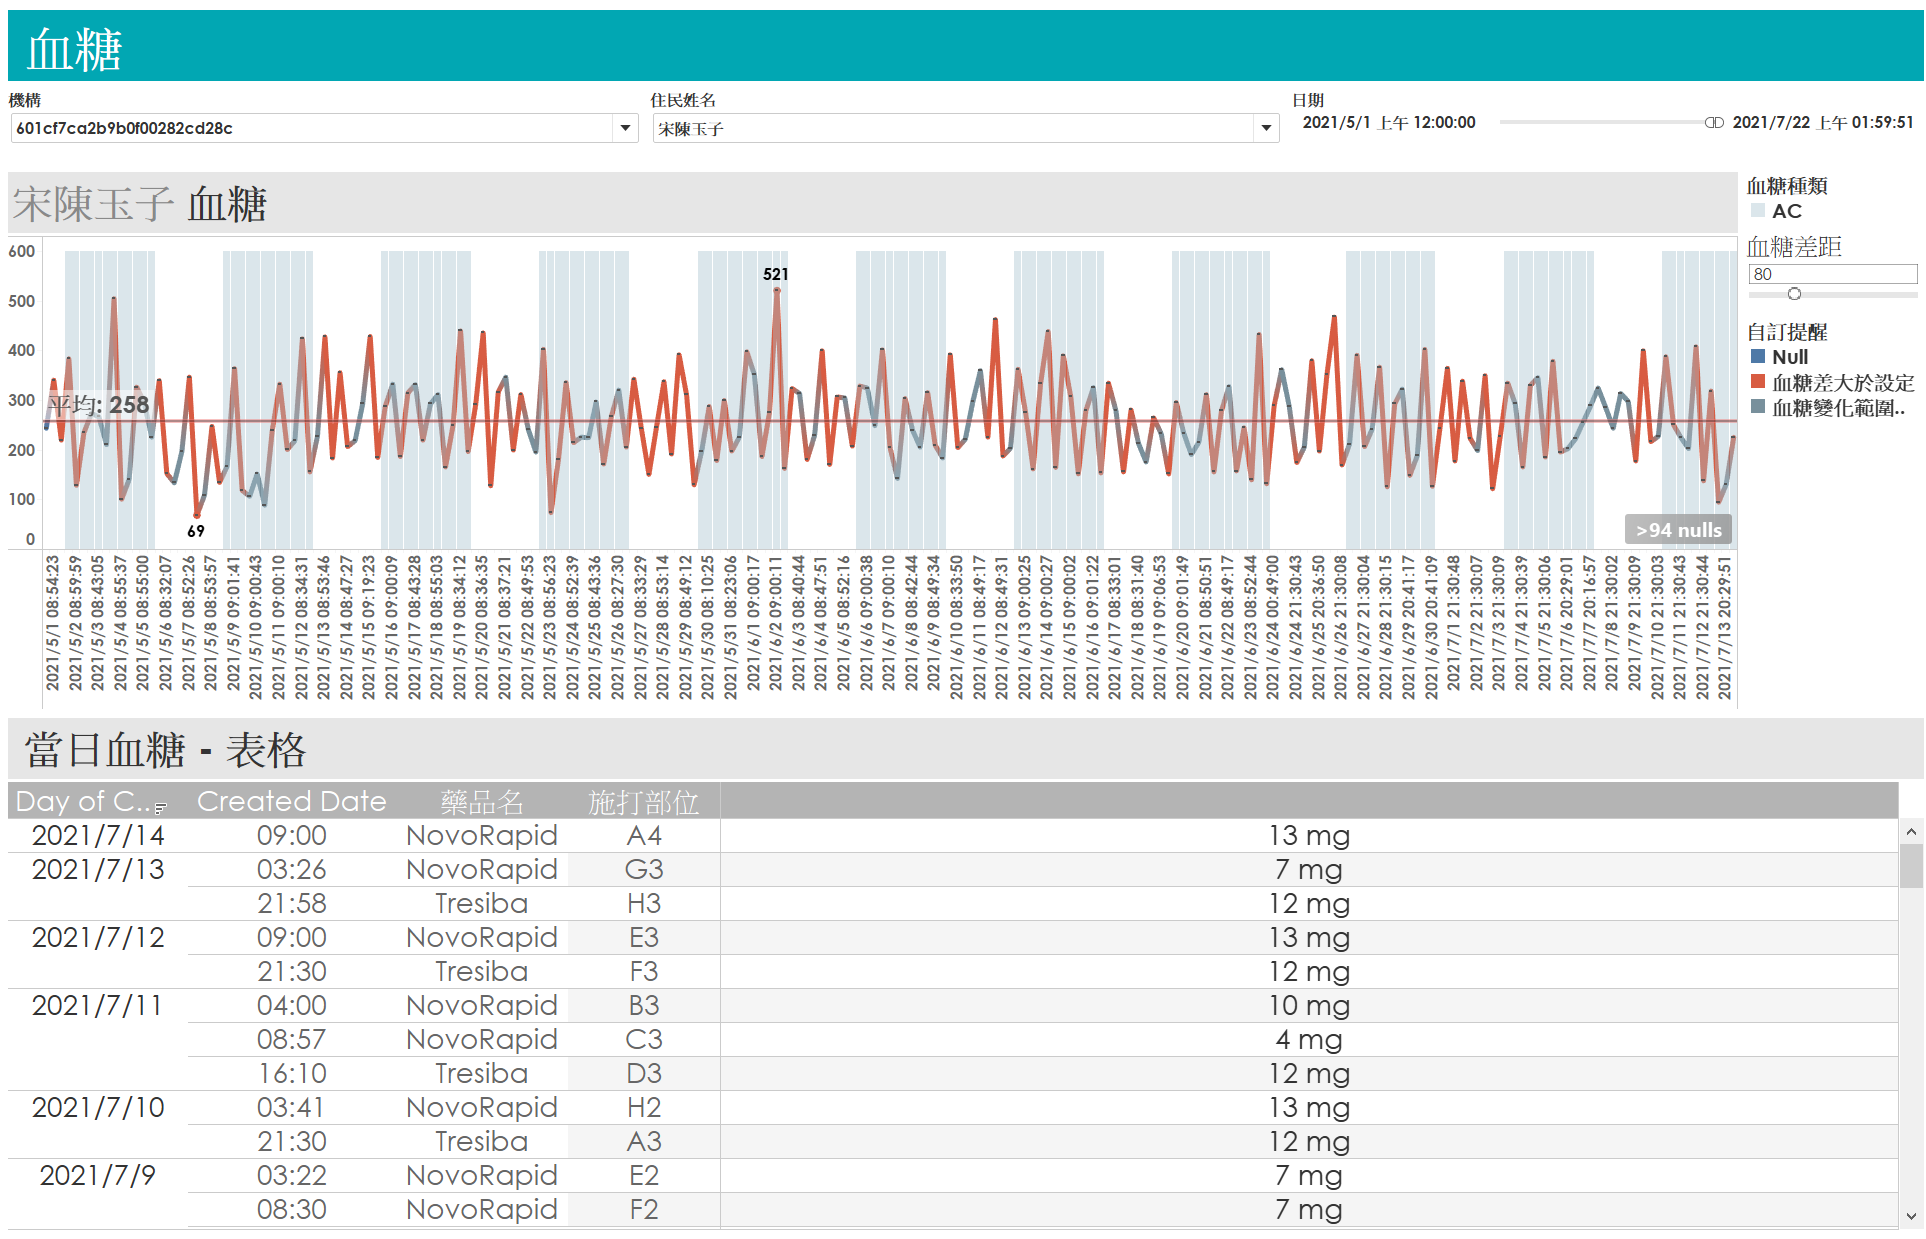
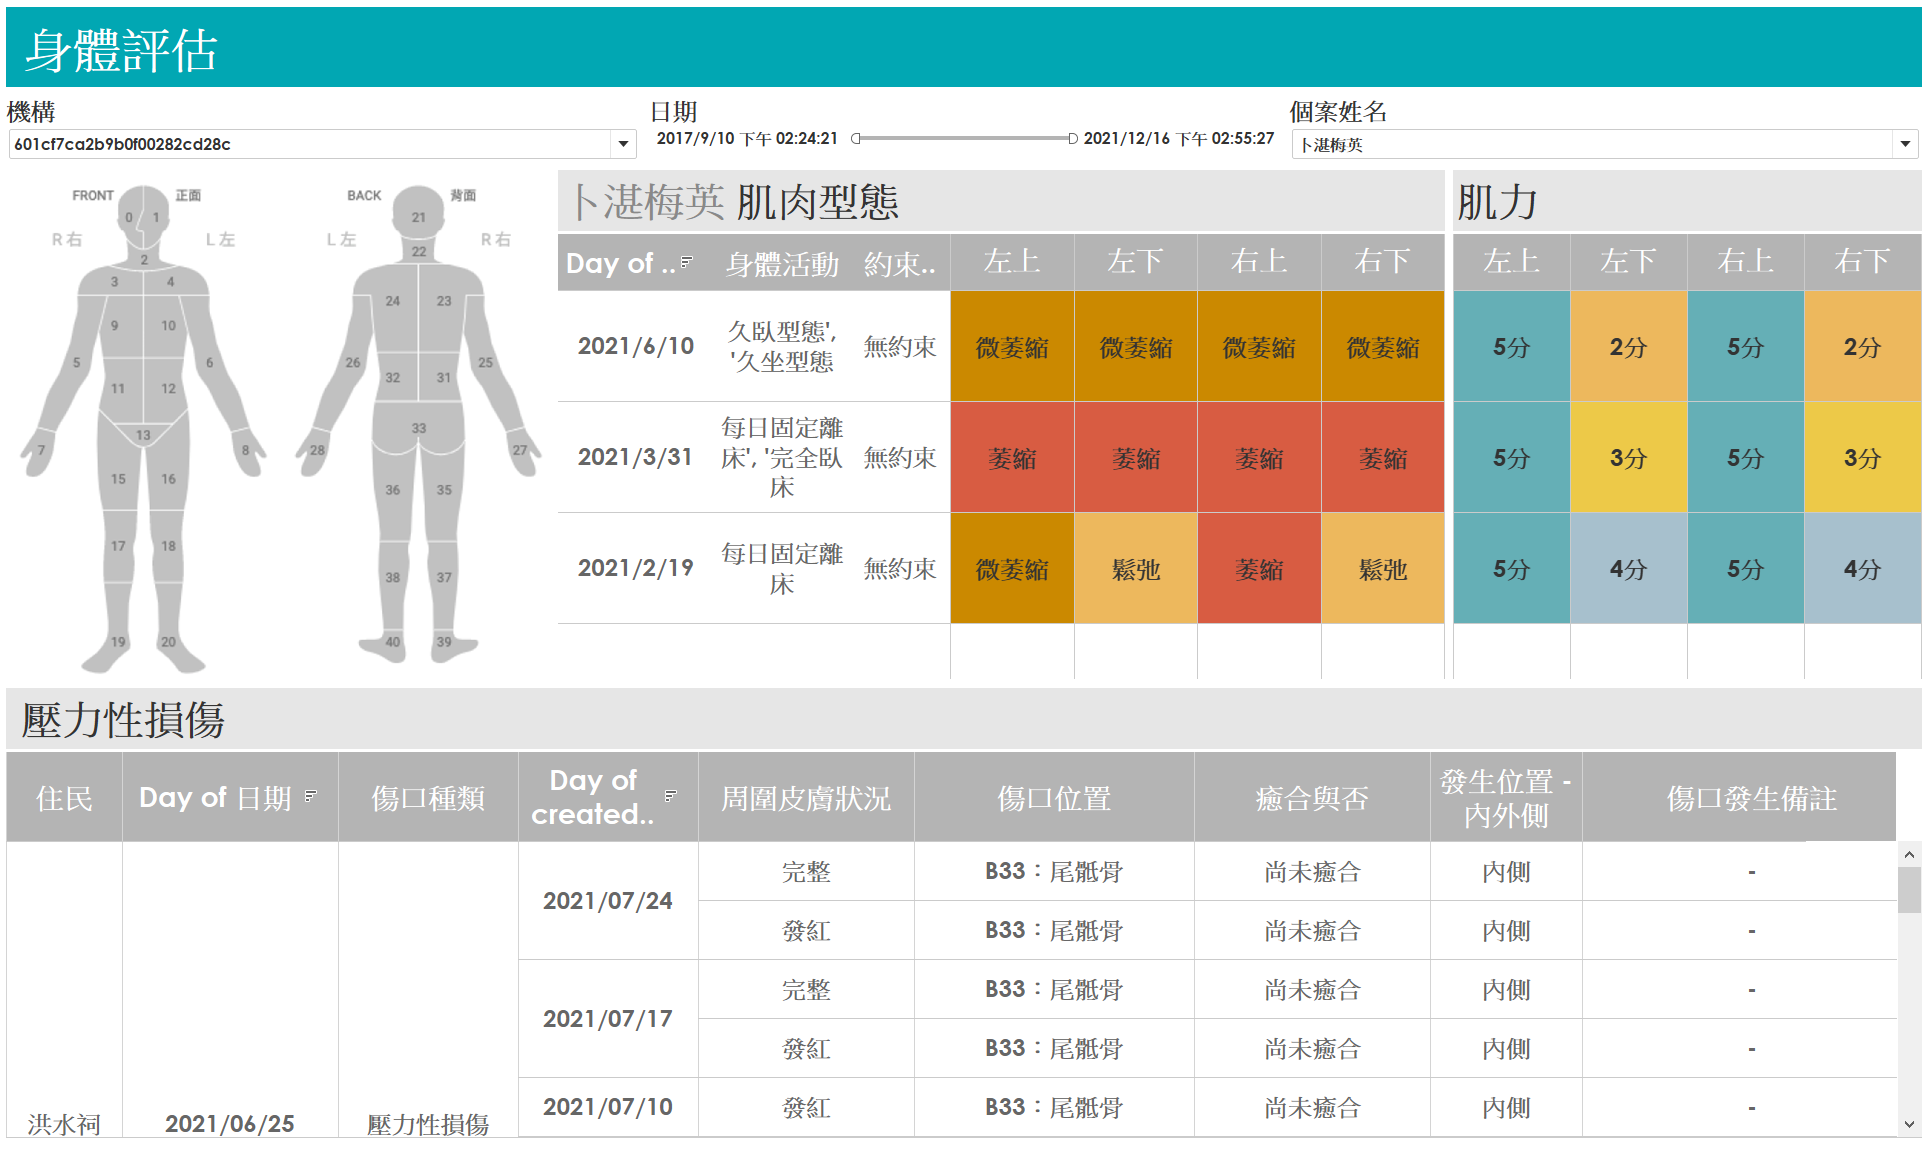
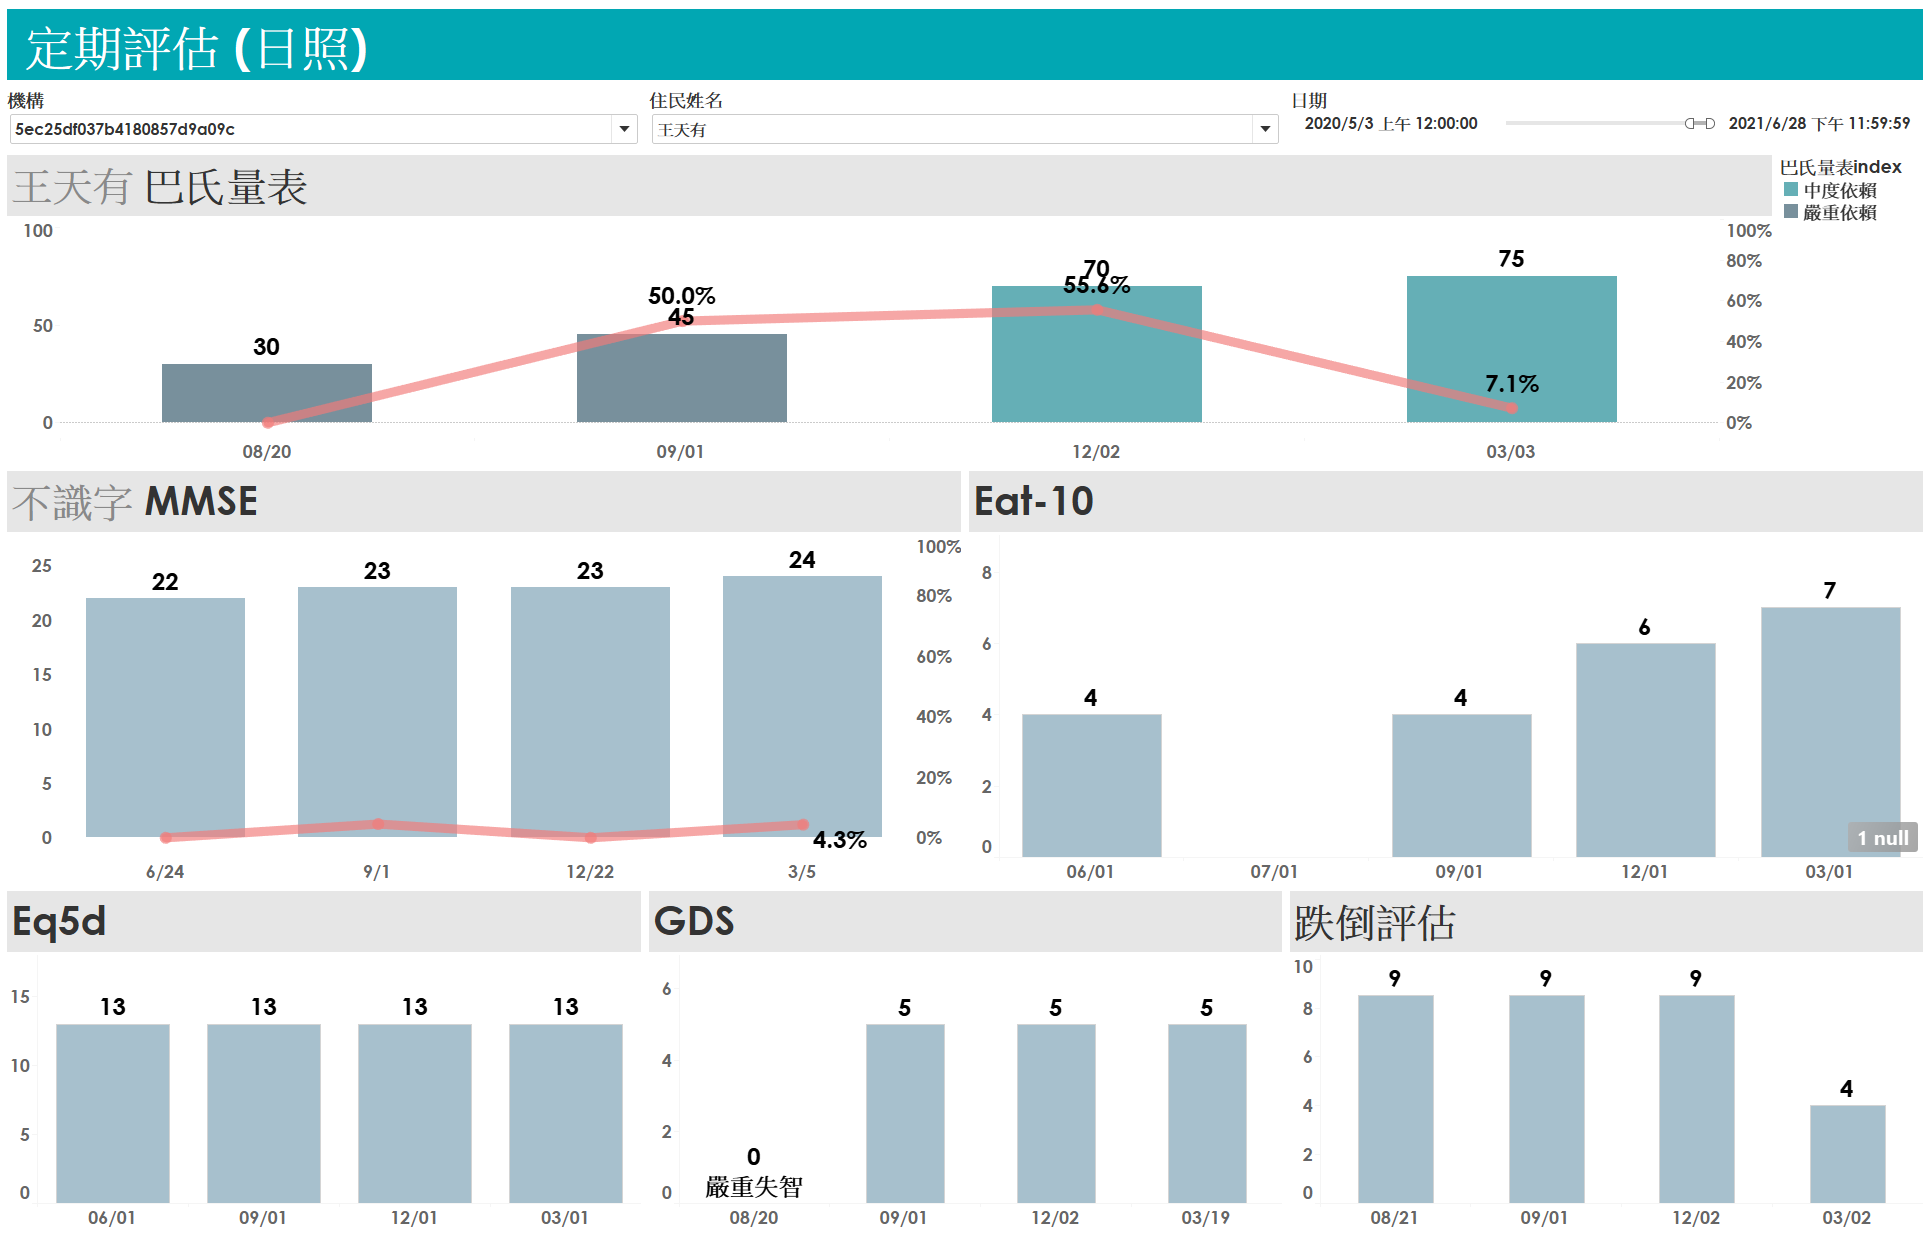
Retrived data from 25+ MongoDB collections, including Weights information, Nutrition Records, Mini-Nutrition Records, Blood Sugar Records, Insullin Records, Vital Signs, Regular Assessments(Barthel index, SPMSQ, IADL, EQ-5D...) and data related to personal health records.
Dashboard Modules
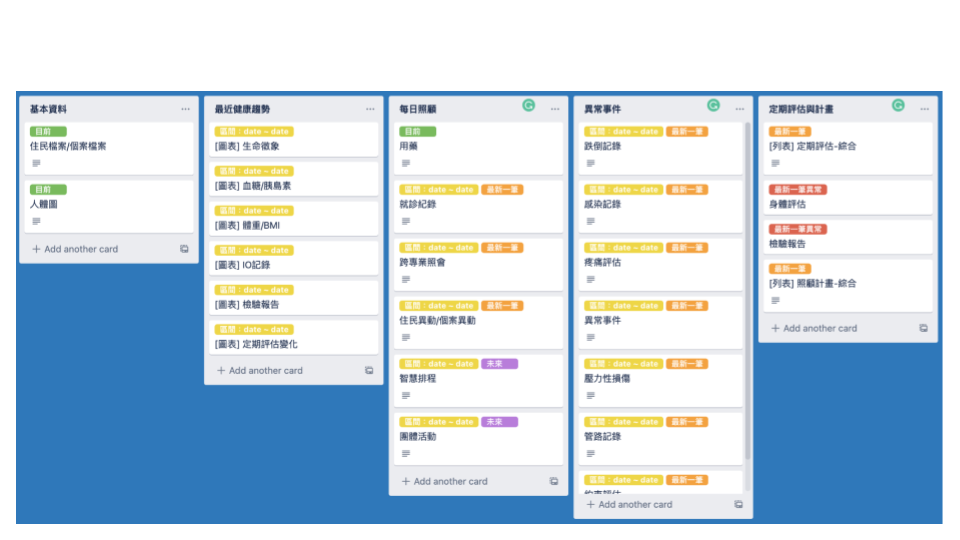
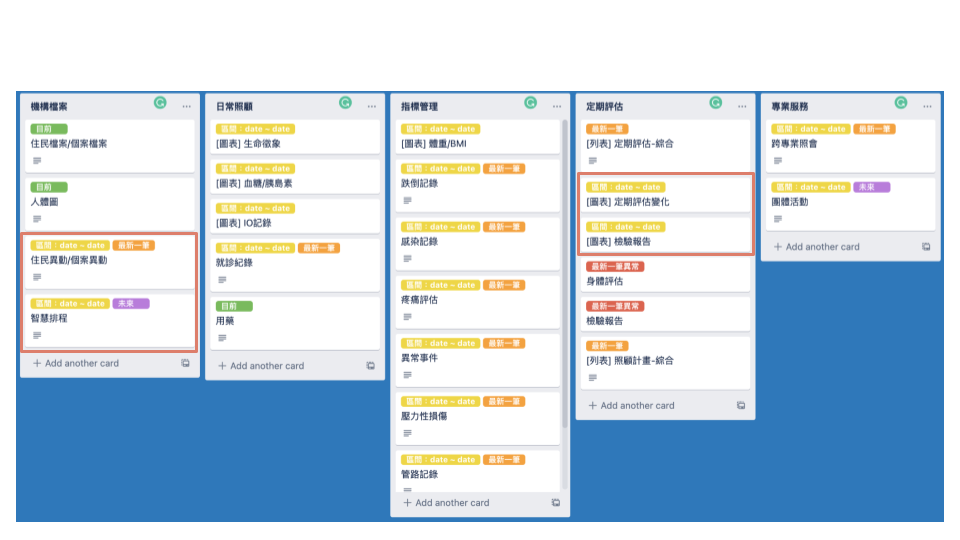
The presenting order of the dashbaord for busy care providers are essential. After discussion with stakeholders and conduct usability testing, we came up with two options.
Design Process
