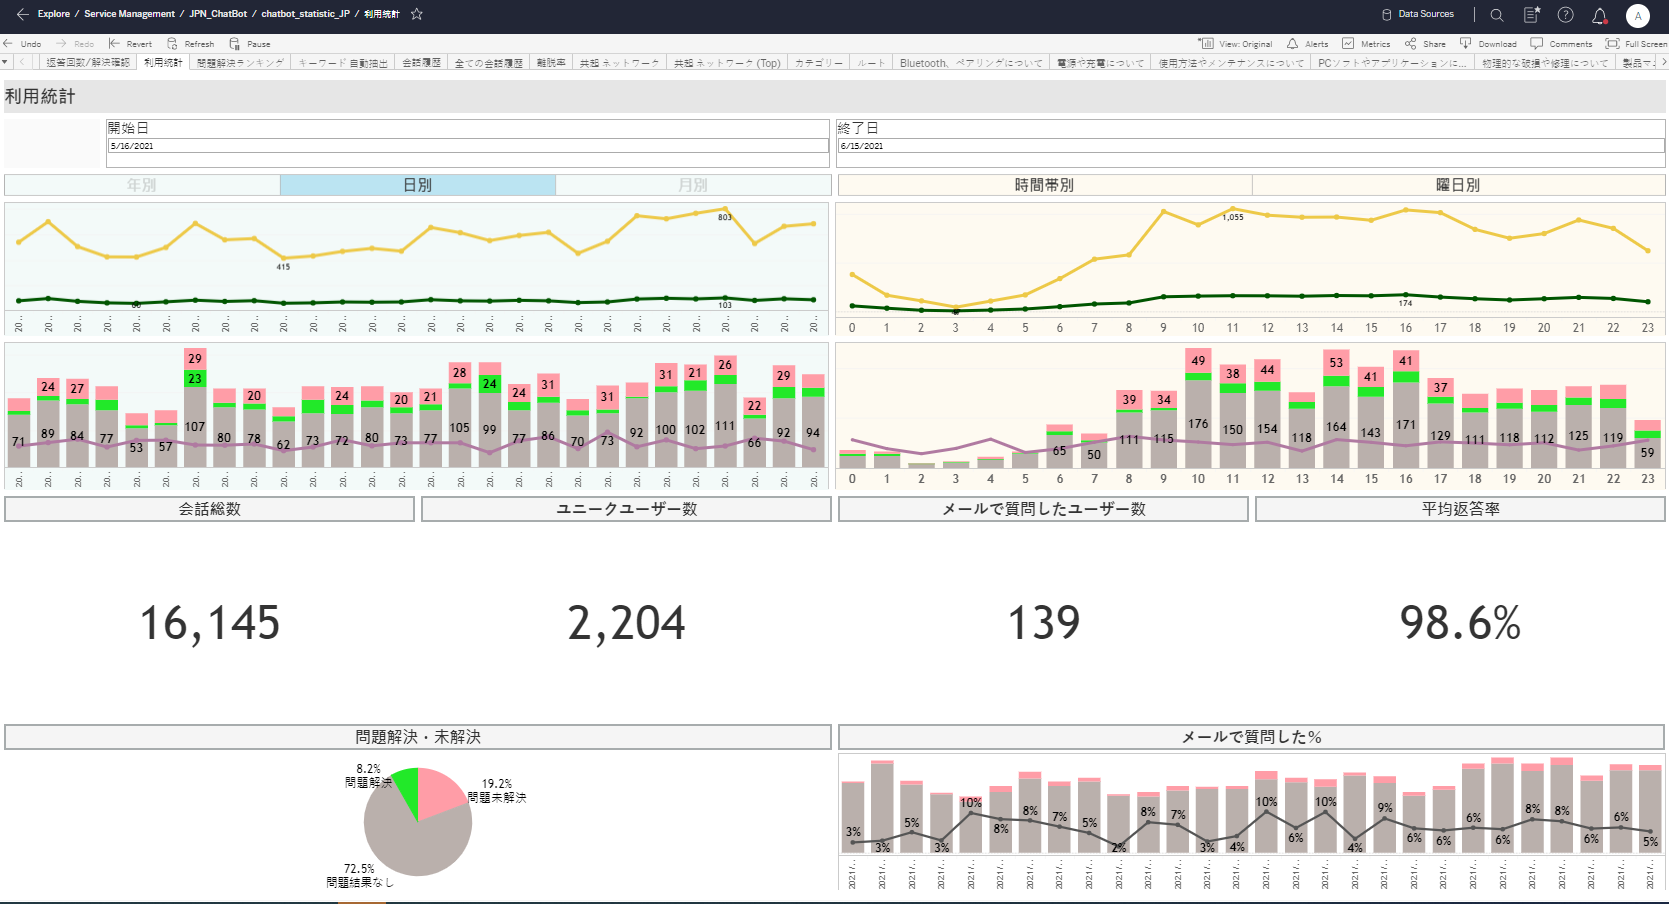
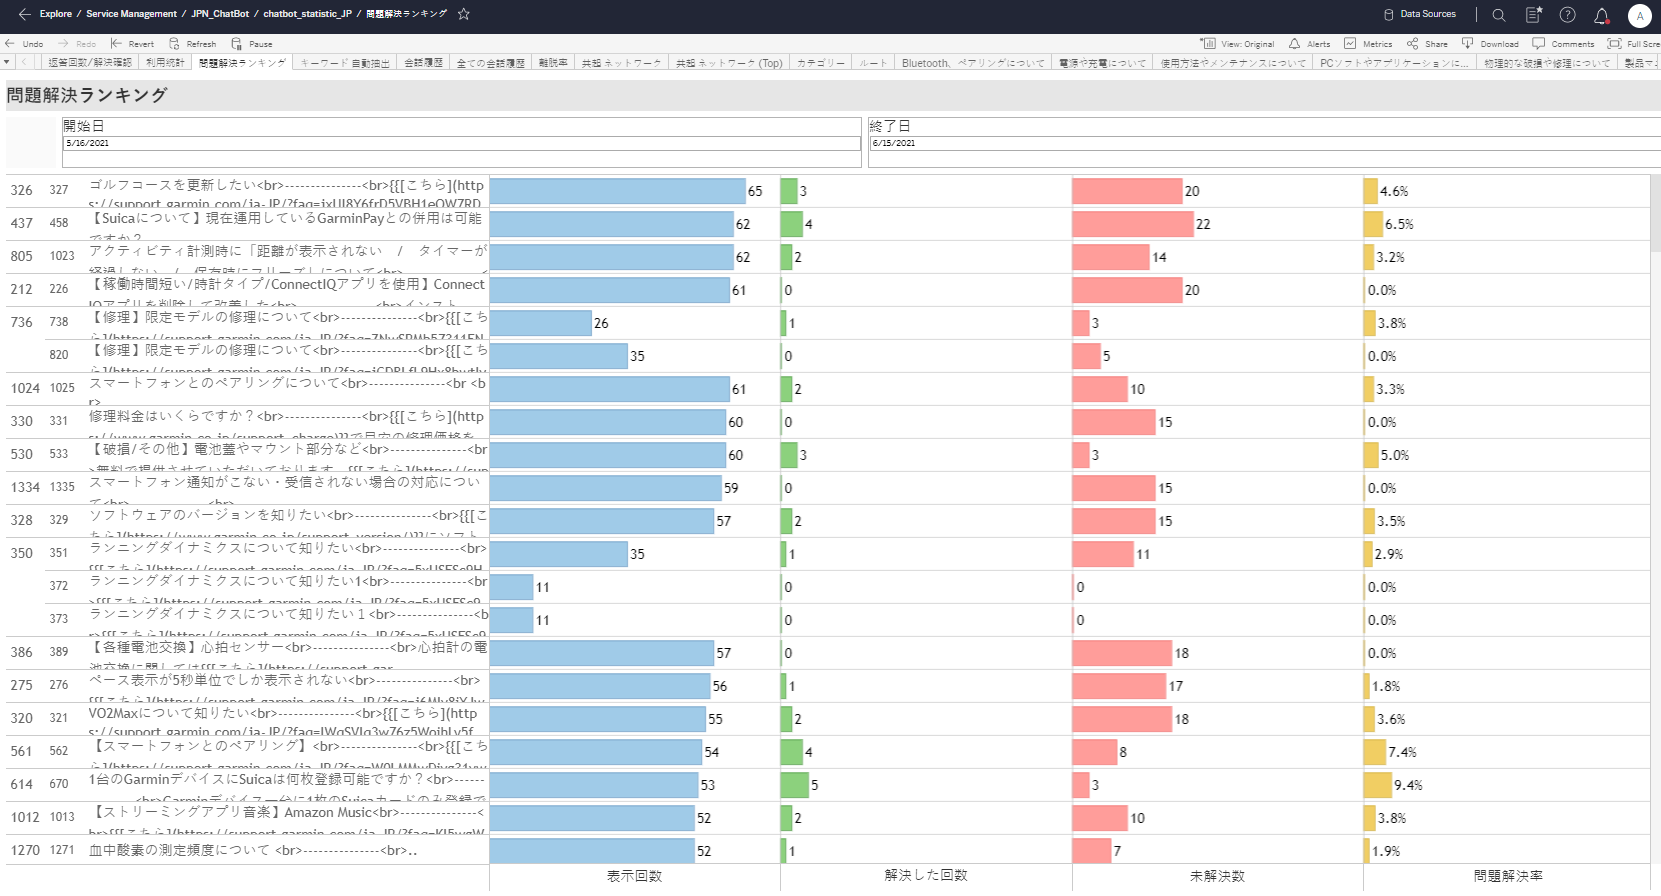
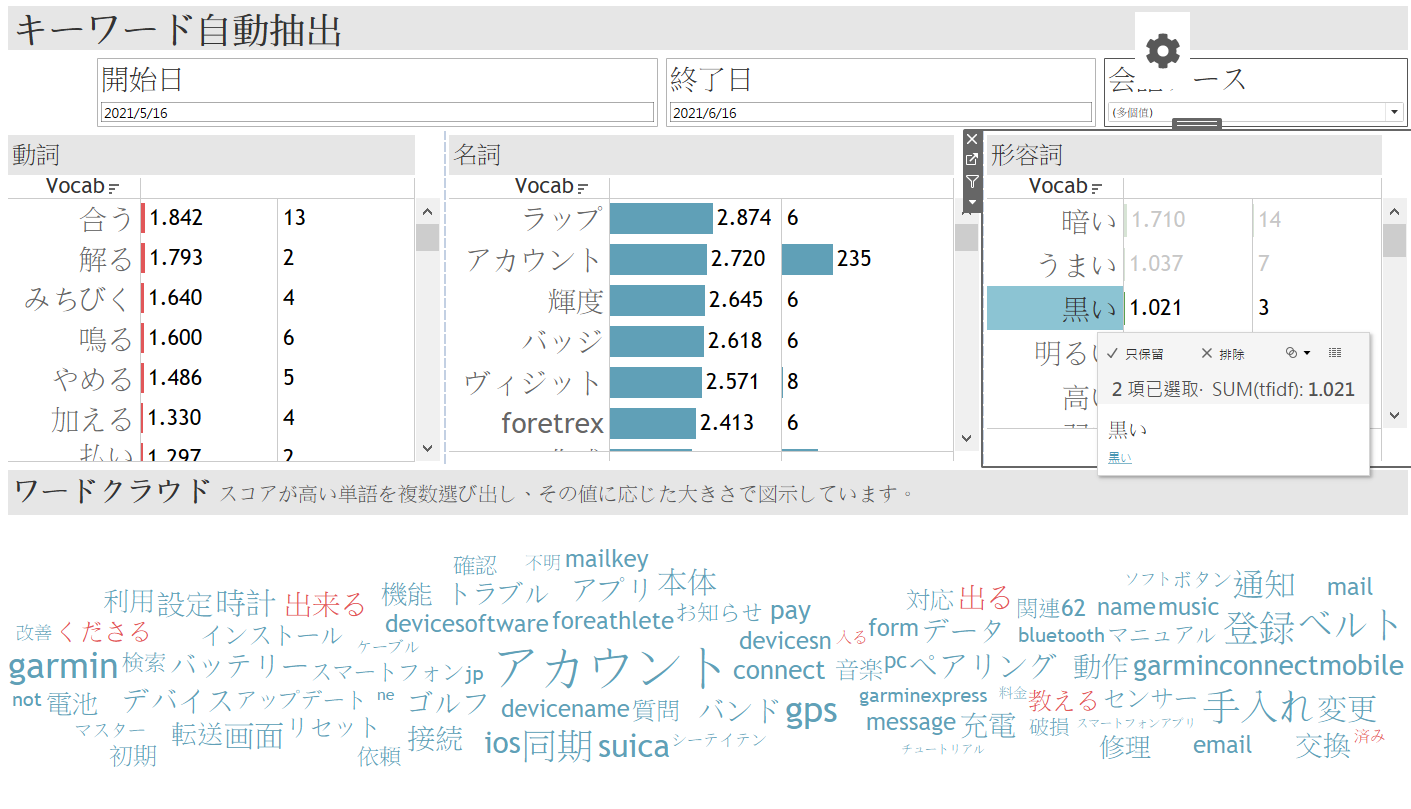
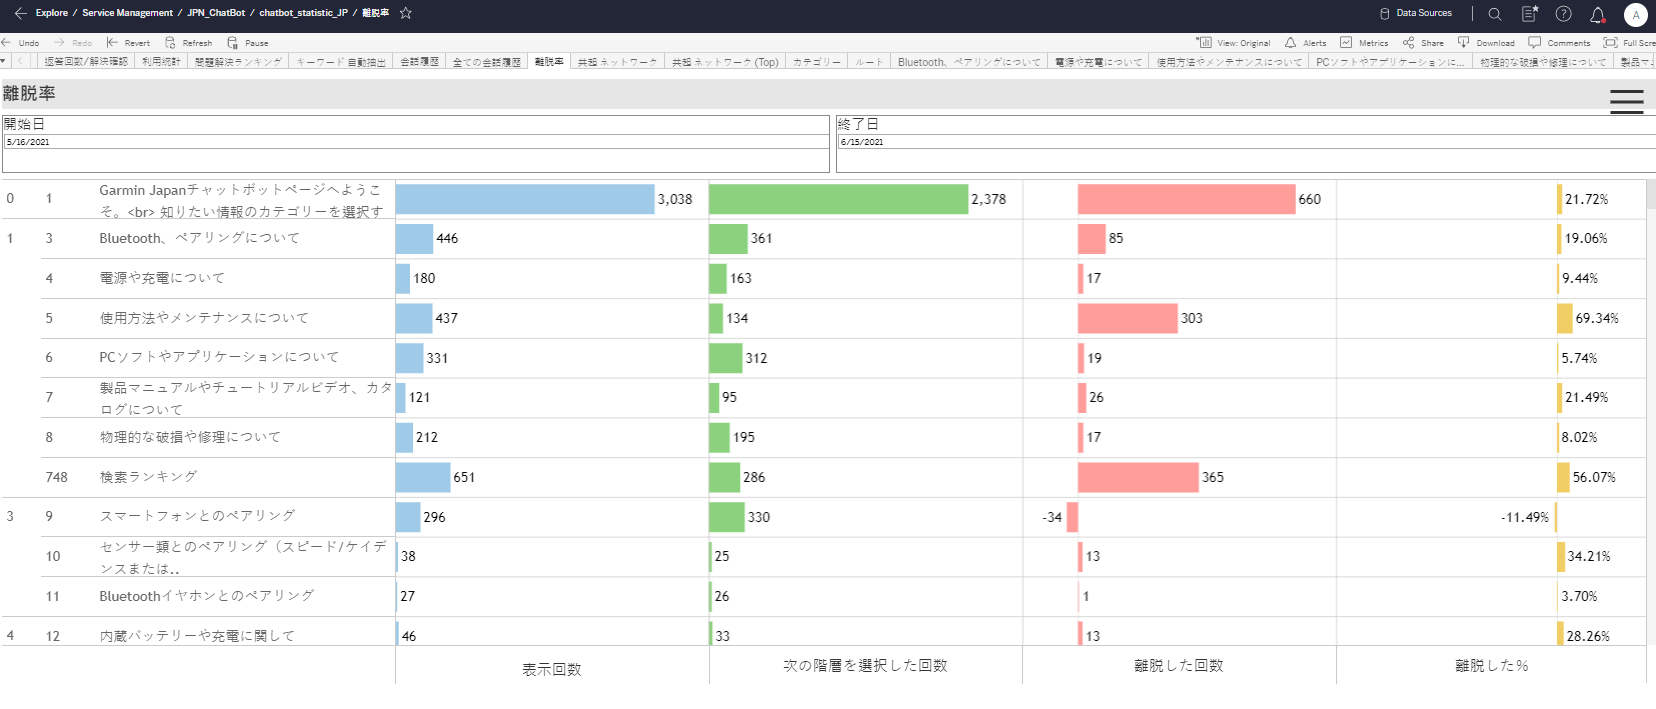
Background: This project was my first large-scope and leading project at Garmin. The work allow me to hone my analytics skills by applying different Machine Learning methods to generate business insights.
Garmin Japan has reached out to me for a solution to analyze the newly developed web chat system to improve and enhance the existing functions that the web chat provides. The aim was to replace a 3rd party outsource platform to cost down and maximize efficacy.
The project was separated into two phases from Developing to Production:
- Cooperated with Garmin Japan’s
customer support team, sales team, IT team to discuss the analysis metrics and algorithms on
Natural Language Processing (NLP). The dashboard scope is across
log data, text data, network graph, and tree structure data. Conducted weekly meeting with stakeholders to validate weekly progress.
- Automate and designed the
Extract, Transform, Load (ETL) process to update the dashboard twice per day. Transformed raw data from MySQL to MariaDB for
log data manipulation, processed python scripts for
text data mining, and updated them through Airflow. Embedded Tableau dashboard into Microsoft SharePoint application for internal access.
Motivation: The long lasting issue on manpower shortage within customer support function is especially severe in developed country such as Japan. It is simple to find a modern solution such as chatbot, yet how to analyze and how to interpret the data is something that worth diving in.
Development Process
25Feb
Data Structure
Participated Back-end data structure development with Software team. Understand data schema and definition to ensure a smooth transition with going to the next stage
12Mar
Develop Metrics
Referenced a third-party chatbot analysis website as the banch mark, analysis scope includes text data and log data. Total exceeds 30+ metrics.
26Mar
Design Algorithms
Developed the algorithms for text network analysis. First to conduct text segmentation using Python, then calculate the Tf-idf value of each word as node weight, and calculate the frequncy each two pair of words in a sentence showed up as line weight, and finally constructed a dynamically generated Network Graph using Tableau
10Apr
User Testing
Validate data and metrics by the Japanese Customer Support Team. Refined metrics and design back and forth for clarity and making sure both of us are on the same page
26Apr
Deployment
Finalized the entire automation ETL process from extracting data from multiple database (MySQL as the original database, SQL Sever as the second database to store processed log data, MariaDB as the database to store processed text data). Completed Airflow script to automate the process with hourly refresh on dashboard
The top 5 most desirable features within an individual health monitor dashboard is:
Outcome


